You’ve written the script, created the graphics, and made your explainer video. You’re hosting it on the homepage of your site (way to go), and you’ve launched your shiny new video on every social media platform from YouTube to Facebook. Congrats! But your work isn’t done. Now, it’s time to track video metrics to see what works and what doesn’t. These 6 video metrics will help you create better custom audiences, build more effective landing pages, and write better CTAs to increase engagement rates and site-wide conversions.
Video Metrics & Marketing Objectives
Before we break down the importance and applications of these 6 video metrics, it’s worth noting how certain metrics inform your specific video marketing objectives. Tracking the wrong metrics is worse than a waste of time—it’s misleading. Make sure that your video metrics correspond to your primary video marketing objectives. Wistia made this handy image to explain some of the most common objectives and their corresponding video metrics.
As the graphic shows, different metrics help you measure progress toward different goals. For example: Tons of comments signals a completely different level of engagement than total view count. The same goes for social shares vs. bounce rate.
For an educational explainer video, your most relevant metrics are likely play rate and watch rate. Both indicate that the content is engaging and relevant to your audience. Meanwhile, videos introducing a new product (or outright selling it) should track CTR and social shares. The point is: the “right” video metrics depend on your goals. Ideally you want to define your objectives before you make your video, but if you didn’t, try to at least define your objectives now so you know which metrics to track.
The risk of defining your video objectives after you look at the video metrics is that you’ll be tempted to massage the data to support whatever objective you’ve defined. A lot of views, while a good sign of interest, does nothing for driving sign-ups if you have a low CTR, and no amount of metric magic can change that. Remember the “Texas sharpshooter fallacy.” Don’t redraw the lines after your video metrics tell you something that you don’t want to hear.
1:Video play rate = Relevance
High view counts are exciting, but not every explainer video has to be a viral video sensation. In fact, just tracking views can make a video seem more useful than it really is. Since many social media sites are autoplay enabled, the video may be running, but that doesn’t mean anyone is actually watching it. It’s the age old “If a video falls in the forest…” argument. If nobody watches your video it’s the same as not having one. Play rate—or the percentage of visitors that click play—is a much more accurate indicator that your video is finding the right audience.
Tracking the percentage of people that click your video—especially on your homepage or landing page—can help you adjust your video marketing strategy to capture more viewers and increase conversions. Make sure you use an enticing video thumbnail to encourage users to click your video. You’ll use this thumbnail for YouTube, Vimeo, newsletters, and email outreach, and anywhere else you need a still image to promote your video. Spend a little time crafting an engaging video thumbnail, and see if play rate increases.
2: Video Heatmaps: A Different Kind Of Video Metric
Video heatmaps are a video metric that will tell you not just if people watched your video, but how they watched your video. Sound super useful? It is. If you’re unfamiliar, a video heatmap is a insight tool that visually displays the portions of a video viewers spend the most time watching. Much like website heatmaps that track mouse location, scrolling rates, and clicks, video heatmaps are a great way to visualize engagement rates, watch rates, actions and drop off points on the timeline of your video.
Wistia heatmaps are a useful resource because they include relevant viewer data (device, location, referral page, time of day) in addition to color coded reports of viewer activity. You can see when viewers paused your video, skipped ahead, and even rewatched sections. These insights help you spot any potential engagement gaps that are killing your conversions. They can also highlight parts of your video that resonate with viewers. You can even track when viewers take action (like clicking on your video annotation or CTA) and see where they go next.
This granular approach to real-time video metric tracking is a powerful tool if you apply it well. Crazy Egg, HotJar and Heatmap are just a few heatmap metric sites with affordable plans to get you started. And remember, you can also apply traditional heatmaps to landing pages that feature video. Watch how many people hover over that play button for some instant feedback on the engaging power of video.
3: Viewer Engagement
According to Crazyegg, the the more videos a site visitor watched, the more money they spent. A visitor who watched just one video spend about $150 on average while a visitor who watched 3 videos spent almost $200. If that doesn’t make you want to track engagement rates, nothing will.
Audience retention is one of the many SEO benefits of landing page video. Video makes your page “stickier” to incoming users, since it promises a quick and visually stimulating summary of the information on the page. Make sure you position your video “above the fold,” that means instantly visible without having to scroll, to maximize your potential play rate. Pay attention to drop-off points in your video engagement metrics to see if viewers are sticking around to the end of your video.
Play rates and heatmaps can help you get a handle on engagement, but pay attention to how many videos visitors watch. If it’s just one, your video might not be all that engaging. If they’re binge watching three or four at a time, congratulations, you’re making truly engaging videos.
Domain & Website Video Metrics
YouTube isn’t the only place to track your video metrics. If you’re adding video to your homepage or a dedicated landing page, chances are you’ll see a spike in engagement, increased dwell time, and a lower bounce rate. Track these changes! Comparing everyday SEO metrics is a great way to see if video is driving conversions and engagement on your site (that’s kinda the point of making a video in the first place).
4: Bounce Rate Metrics
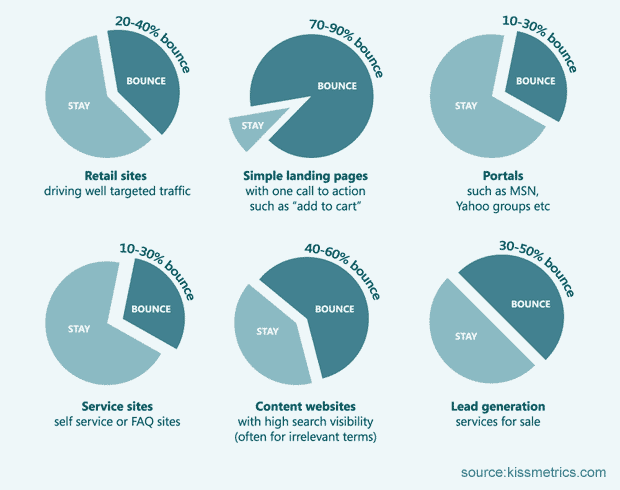
Bounce rate is one of the clearest indicators of whether the content on your web page is working. Google calculates your bounce rate by dividing the total number of visitors that leave your site after visiting one page by the total number of visits. Monster Insights put together this handy graphic to help you visualize where you stack up to your competitors when it comes to bounce rate.
Bounce rate is a key metric, and can help you decide if more videos might be helpful. If the pages with video radically outperform pages without video, well, it’s clear what the difference maker is. For example, when Daniel Loeschen, Marketing Director for MixerDirect wanted to track their key objective—engagement—he used bounce rate as his yardstick:
“We paid a lot of attention to measuring our videos’ success [using] overall site bounce rate. Over the last year and a half as we have had added more and more videos to our product pages, blog pages, and category pages, we have seen almost a 20% decrease in bounce rate, which means that customers and potential customers are finding value in our content and that content is nurturing them toward a purchase or quote request. For us bounce rate has been very important to measure the impact of an overall video strategy.”
Different industries have different average bounce rates as Neil Patel explains in this infographic. As a general guideline, a 30-50% bounce rate is excellent and 80%+ is terrible. Everything in between depends on your content, industry and your marketing strategy.
FYI: People bounce from websites all the time. If your bounce rate is below 20% it’s probably a tracking error or really low site traffic. Nobody is that good.
5: Social Shares
Decision makers are increasingly influenced by online video, but they’re also driven by influencers, social shares, and online reviews. Nielsen found that 92% of consumers believe recommendations from friends and family over advertising. People are just more likely to trust their inner circle than they are to trust an ad. Social shares build trust and strengthen consumer confidence because they come from friends, family, or trusted influencers.
Fortunately, you can make some smart choices to increase the odds of your link being shared. Even though Twitter just doubled its character limit, nobody wants to share, or click on, a link that’s mostly numbers. Which of these links seems more appealing to you?
- http://www.prettyurl.com/hotel-dream-vacation
- http://www.example.com/hotel-abc.jsp?fitness_centre=y&Ne=292&N=461+4294967240+4294967270
Tools like bit.ly can help you create short, customized URL’s and track the number of clicks each one gets. Make it easy for people to share your video, and don’t be afraid to ask viewers to share. Then track the results.
6: Conversions
A lot of companies create explainer videos to increase conversions, and rightly so. Video gets prospects over the obstacles that keep them from opting-in. Email signups, downloads, subscriptions and sales, known collectively as “conversions” are great ways to track the real world impact video has on your bottom line.
Phil Nottingham, a independent video strategist says:
“If you’re creating a video to improve conversions i.e. increase the number of people pressing the “add to cart” button on your website, then more or less the only metric you should care about is conversion rate at a page level. This is predicated by ensuring you have a decent attribution model, but once your analytics is in good order, this is the metric.”
There are a few different ways to track how people are converting depending on your video hosts. Adstage has a great guide to get you started on the process of conversion tracking using Google Analytics.
Make sure you test CTAs to see which is the most effective at driving conversions. The right CTA is simple, clear, and direct. The viewer should easily understand what you want them to do and feel compelled to do it.
Video Metrics That Matter
Video metrics matter. It’s not enough to upload and share your video. Choose video metrics that relate to your video objectives so you can improve your video assets for the highest possible ROI. Quality videos last a long time. Hone your video content and targeting with informed video metrics and your explainer video could drive conversions for years.
For more information on how to succeed with animated video, download our free eBook below.


