You’ve created a high-quality video and posted it to YouTube. You hope it’s catching the attention of potential customers and driving them to your site. Ideally it will increase conversions. But how do you tell if any of this is happening? The answer lies in your YouTube Channel Analytics.
YouTube tracks all kinds of information about your video performance. Understanding which metrics matter can help you measure progress toward your marketing goals.
Gather the Data You Need to Make Informed Decisions
Don’t jump to conclusions based on a few hours or even a few days of data. Unless you’re reporting breaking news, the success of your video comes from the long-tail. You may not get a huge number of viewers on day one, but views and engagement add up over time. Wait to draw any conclusions until you have a few videos published and have given them time to gain traction.
Where to find your YouTube Channel Analytics
The good news is you don’t need any extra software to track your YouTube channel analytics. YouTube collects information about your videos and shares them with you on your channel dashboard. To find this information follow these steps:
How to see Channel Analytics on YouTube
1. Sign-in to your YouTube Account
2. Click the round profile image in the upper right, this will open a menu
3. Select YouTube Studio from the drop-down
4. Find and click Analytics in the menu on the right
You’ve found your YouTube channel analytics screen. From here, you can see an overview of your channel’s performance as well as data on Reach, Engagement, and Audience.
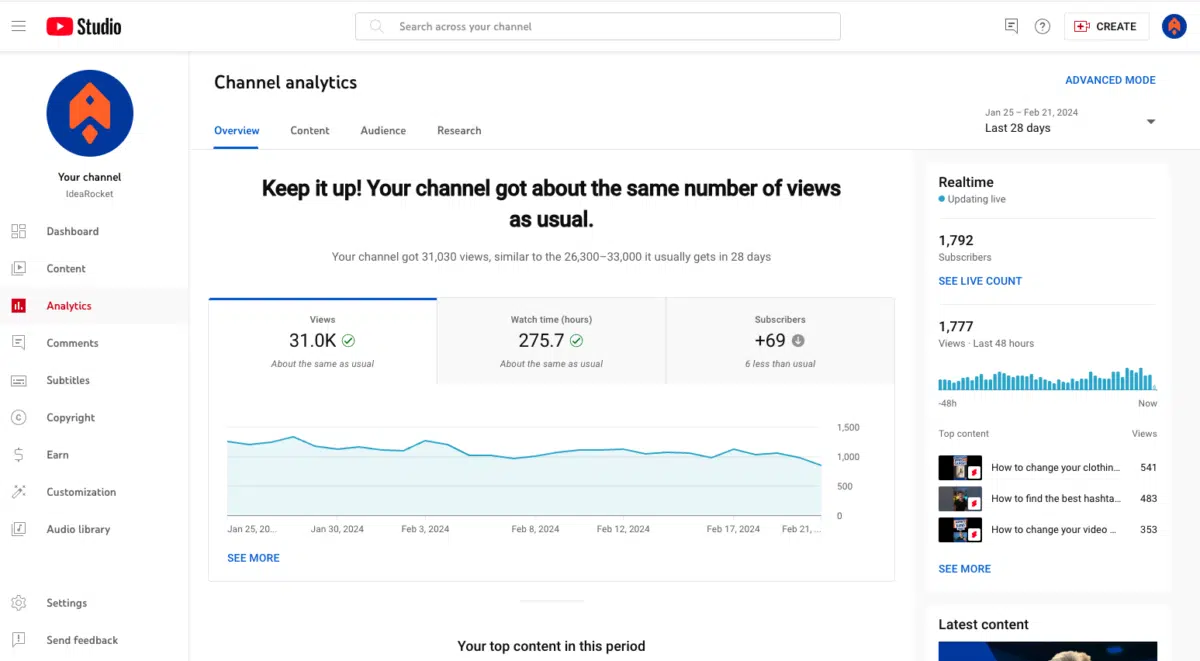
Keep in mind that this screen reports on the performance of your entire channel. If you want to see analytics for a specific video, you need a different screen.
How to see Analytics for a Specific YouTube Video
1. Sign-in to your YouTube Account
2. Click the round profile image in the upper right, this will open a menu
3. Select YouTube Studio from the drop-down
4. Find and click Content in the menu on the right
5. Find the video you want to analyze
6. Click the Analytics icon
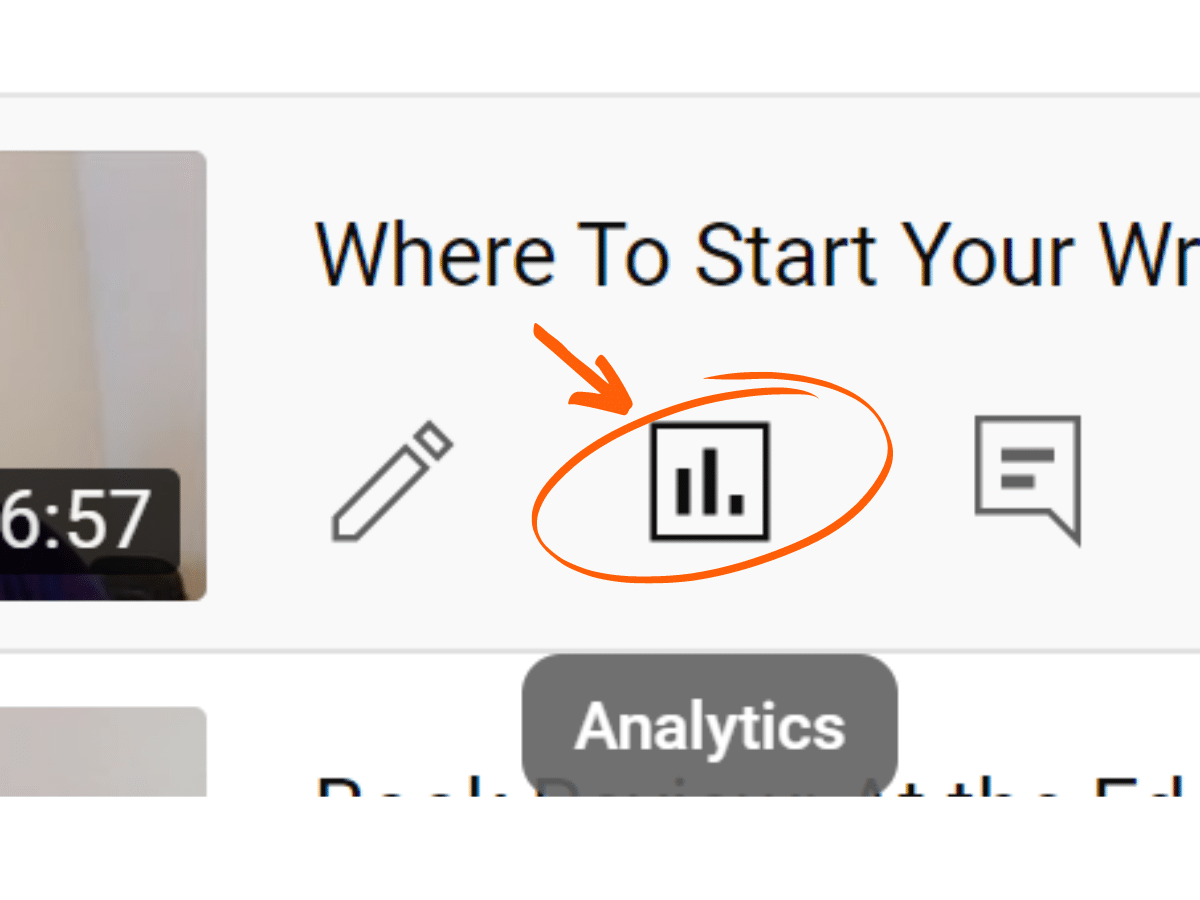
Here you’ll find reach, engagement, and audience statistics for the video that you selected. Let’s take a look at each of these YouTube channel analytics, and what they can tell you about your video’s performance.
1. Reach: How Are People Finding Your Video?
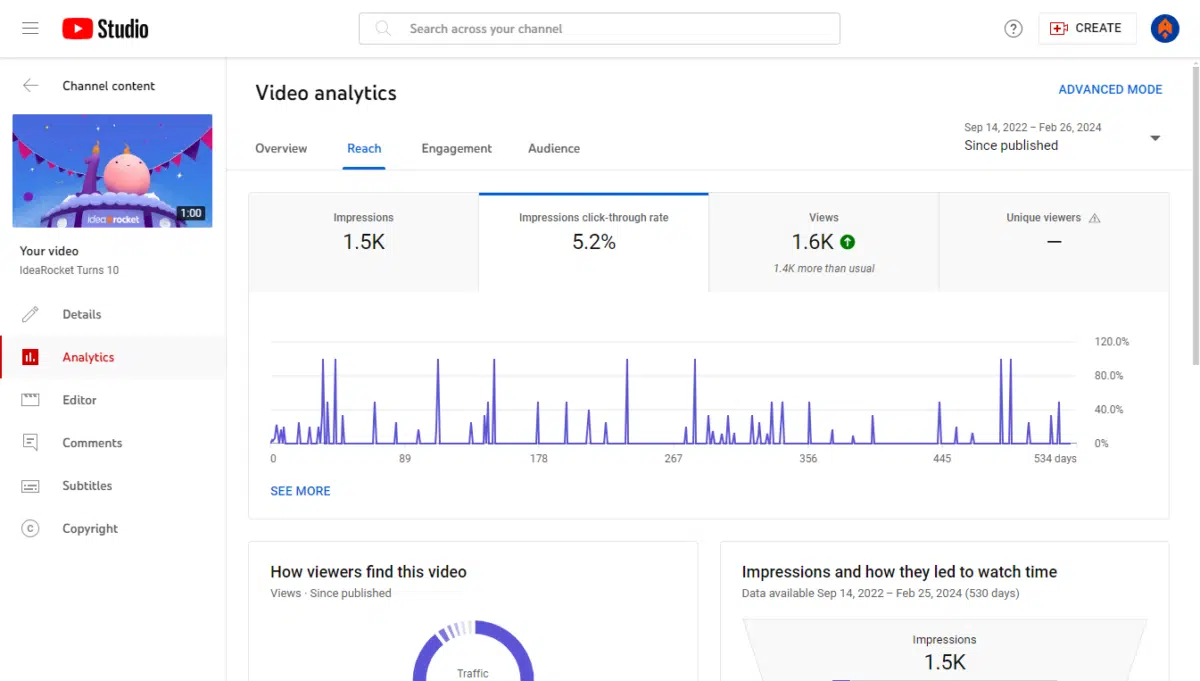
If your primary goal is to be seen by as many people as possible, reach is your go-to metric. The impressions tab tells you how many times YouTube served your video and how often people accessed it from an external link.
Impressions click-through rate tells you what percentage of people who saw your thumbnail actually clicked. The views tab gives you information about how many people watched your video. There’s even a tab showing you how many of those views came from a unique viewer.
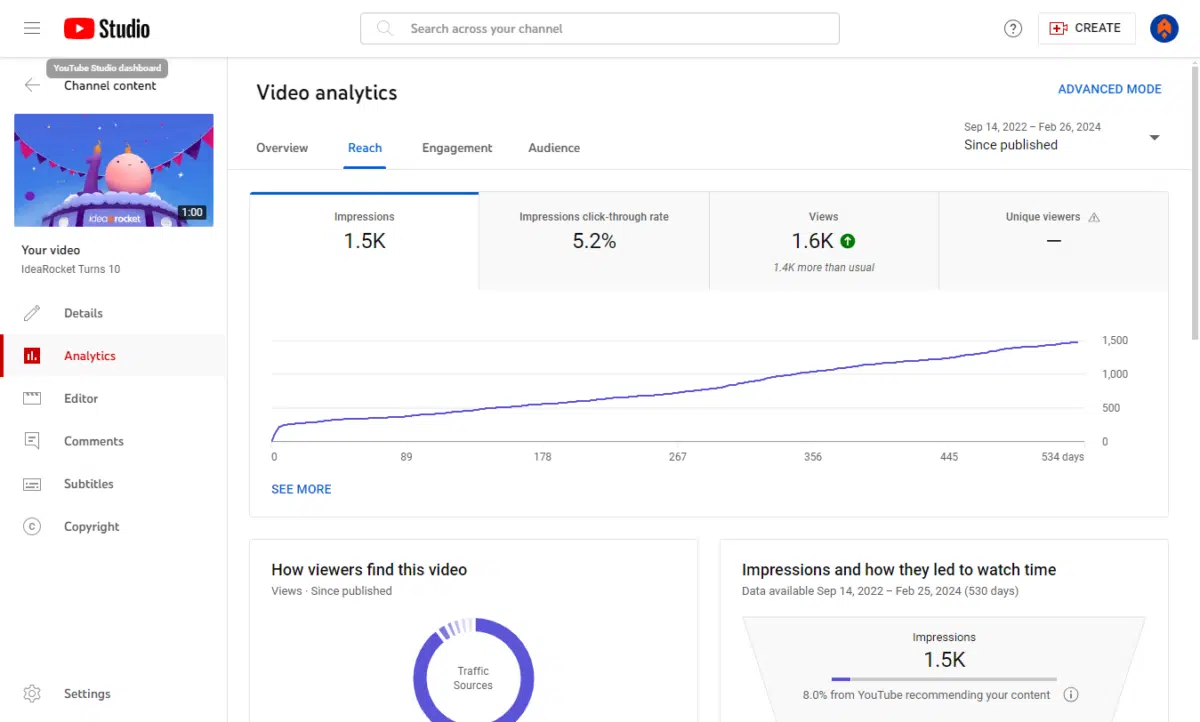
You can choose the timeframe of the metrics you’d like to view including Since Uploaded (lifetime), First 24 hours, and increments of weeks, months, or years.
Impressions
A high number of impressions means that many people are searching for videos like yours or that the YouTube algorithm assumes your content is relevant and is showing it to site visitors.
YouTube also tracks the percentage of views that come from external sources, like an embed on your website, and Direct or unknown sources. Direct or unknown usually includes the link you texted to a friend or the bookmarked link someone has been saving.
How to Increase Impressions
A low number of impressions may mean your content isn’t related to a popular enough topic, or that your topic isn’t immediately clear to the algorithm. Do your research to create content that’s relevant to viewers. Then, make sure you’ve included relevant keywords in your title and description so both users and YouTube understand what this video is about.
Impressions Click-Through Rate
Stated as a percentage, this metric shows how many impressions turned into clicks. Many of the people who see your thumbnail won’t click on it. With around 500 hours of video uploaded to YouTube every minute, your video has a lot of competition. Click-through rate shows whether your video description and thumbnail were interesting enough to grab attention.
How to Increase Impressions Click-through Rate
Surveys show that the average click-through rate on YouTube videos is 4 to 5%. If your videos are doing better than that, they’re above average. Good job! To improve your click-through rate, include an eye-catching thumbnail and title. Then make sure your description isn’t just a keyword stuffed mess. It needs to give viewers a clear idea of what they can expect when they click your video.
Views on YouTube
Theoretically, views are the number of people who watched your video. Why only theoretically? Because view counts only tell you that your video played, it doesn’t tell you whether the person watched the whole video or if they were paying attention when they did so. While views tell you something about your video’s performance, they’re not the most important metric.
How to Increase Views on YouTube
If your thumbnail, title, and description are all good, check the video itself. It should look professional and feature high-quality sound or captions (ideally, both!). Embed your video on your site, or elsewhere on the web (these count as views too.)
Also, make sure you have a video hook in the first few seconds, something that will draw viewers in and keep them watching. The more people stick around, the more likely the algorithm is to serve your video to even more searchers. A hook could be a question, a promise, or an interesting visual.
This video we made for Simplist hooks viewers immediately with the question: Can these people find a mortgage in a way that’s painless?
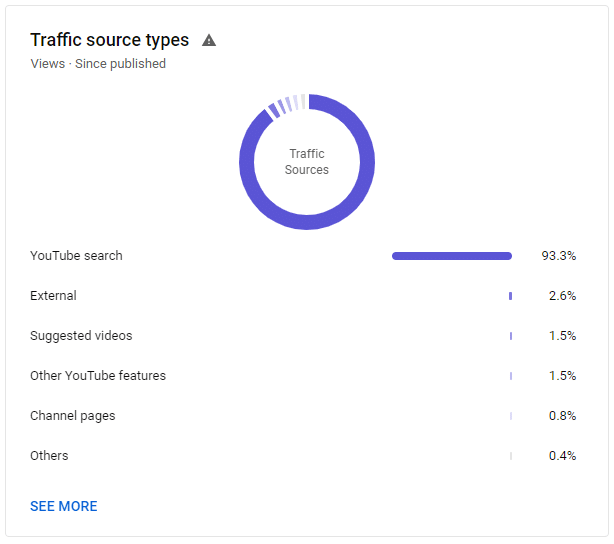
How Viewers Find This Video – YouTube Reach
You can help boost your reach by promoting your video off YouTube as well. Sharing your video on social media, in email, and through blog posts can help push viewers toward your content. Of course, ads can help too.
Two metrics can help you figure out if your off-platform strategies are working—Traffic Sources and External sites or apps. You’ll find them under the main graph on the Reach tab. These metrics tell you how viewers are discovering your video.
2. Engagement: How is your audience retention?
Views alone don’t tell the full story of how your video is doing. You need to combine that information with your audience retention metric. It might hurt to see that people stopped watching your video after just a minute or so, but such feedback is vital for improving your video marketing strategy.
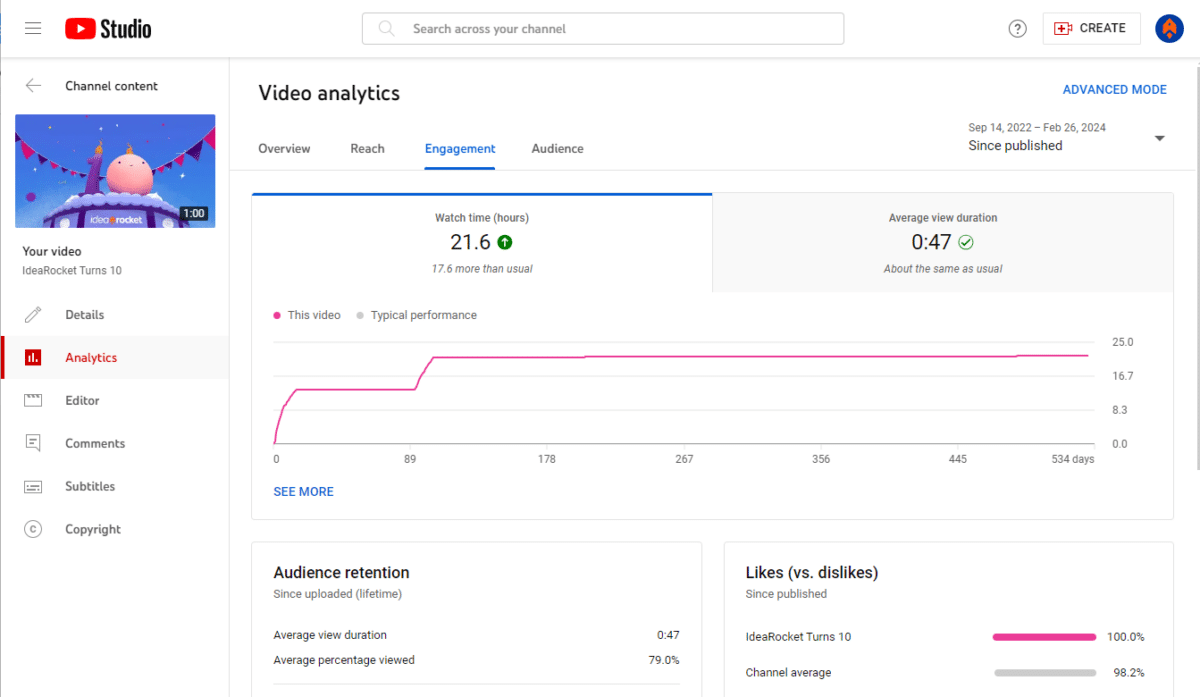
The Engagement tab includes two important pieces of information—average view duration and average percentage viewed. Keep in mind that every video has an initial drop-off, and no video gets 100% engagement. The ideal video length is about 1 minute, so drop-offs around that time are to be expected. That’s how long it takes for people to decide to commit to a video.
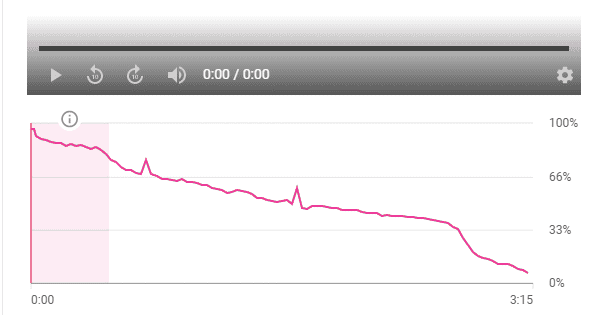
The spikes on this graph tell you that more people are watching, rewatching, or sharing these moments. Dips, like the one at the end of this graph, show you where people are leaving. Pay attention to dips and spikes, they can show you what audiences are interested in.
How to Increase Average View Duration
If you notice a sharp drop-off at the beginning of your video, check that viewers are seeing what they expect. If your title promises 3 YouTube Metrics Worth Tracking, are you delivering three metrics, or are you talking about unrelated topics?
A drop-off around the one-minute mark is predictable, which means you can do something about it. This might be the perfect time to do a quick CTA or introduce a new hook to encourage viewers to stick around.
3. Audience: Who is watching?
The last YouTube Video Metric you should definitely track is your Audience. This helps answer the question: who is watching your videos? If you’re trying to expand your audience, or reach a specific group of people, this information is vital. The Audience tab counts:
- Unique viewers – people who watched your video at least once
- Returning viewers – people who have watched your content before and are coming back for more
- Subscribers – the total change in subscriber count from people who watched this video.
There are a few sub-metrics worth paying attention to here. The biggest of these is Watch time from subscribers. This tells you what percentage watch time came from people who were also subscribed to your channel. In the example below we see a good mix of subscribed vs. non-subscribed watch time. It looks like this video is appealing to the existing audience, but also bringing in new viewers.
If your goal is to build long-term relationships with potential customers, you’ll want to pay close attention to this metric. Subscribers who watch your content are likely to be engaged customers. So make sure you’re delivering content that interests them.
The See More link opens a screen that lets you see average view duration for subscribed vs. non-subscribed audiences. If you’re delivering what your subscribers are looking for, their watch time is likely to be higher than the watch time of non-subscribers.
How to Improve Audience Metrics
Your audience demographics should reflect the ideal customer that you’re trying to reach. If they don’t, you may need to do some research to better align your content with the type of videos that customers like yours want to see.
Keep Improving Your YouTube Channel Analytics
YouTube is the largest video platform in the world and it comes with some powerful video metric tracking tools. Learning to decode these can inform your video creation process. They help you get to know your viewers and give them more of what they’re looking for.
Of course, the best way to improve your YouTube Video Metrics is to start with a high-quality video. The video creation experts at IdeaRocket can help you make videos your audience will love. Contact us to get started.
